|
|
|
Introducing RaveReports are a primary means of retrieving information from the data being managed by an application. To solve the problems associated with presenting a visual report of data in a meaningful and informative manner, traditional visual reporting applications have offered banded layout tools geared toward table-style data listings. Today, however, more complex reporting requirements exist that are not easily handled by banded layout tools. Rave Reports is a visual report design environment offering many unique features that help make the reporting process simpler, quicker, and more efficient. Rave can handle a wide variety of report formats and includes advanced technologies such as mirroring, to encourage the reuse of report contents for quicker changes and easier maintenance. This chapter presents a brief introduction to Rave's features. Additional information about Rave can be found in the online Help files, in the PDF documentation on Delphi's CD, in several demo projects, and on the producer's website.
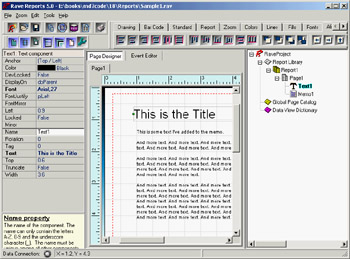
Rave: The Report Authoring Visual EnvironmentTo start the Rave visual report design environment, double-click on a TRvProject component dropped on a form or select Tools ® Rave Designer in the Delphi IDE. When you activate this environment, you'll see a window like that shown in Figure 18.1. As you can see, the Rave Designer includes several sections: the Page Designer, Event Editor, Property panel, Project Tree panel, toolbars, Toolbar Palette, and status bar.
Keep in mind that Rave allows your end users to create or modify their own reports. You can set the Rave Designer level to Beginner, Intermediate, or Advanced in the Edit ® Preferences dialog box (in the Environment section) so your end users will be working at the level they're comfortable with and won't have more power than you want to give them. You can also lock features of the report so they cannot be modified. Page Designer and Event EditorThe central portion of the Rave Designer window hosts the Page Designer (where you lay out the report) and the Event Editor (where you can provide scripts to customize the report at run time). The Page Designer is the most noticeable aspect of Rave. This page is the foundation of a report, where you perform all the designing actions. The page displays a grid pattern, although you can change the look and feel of the page with the preference settings. The names of the current pages being designed appear in the tabs above the Page Designer (Page1 in the figure). The Event Editor allows you to define custom scripting code for the report components. Each component has several different types of events that can be used for calculations, string manipulation, or custom report logic. The Event Editor is an advanced feature of Rave; I'll cover it briefly at the end of this chapter. The Property PanelThe Property panel at left in the Rave Designer helps you customize the way components appear or behave. This panel has a role similar to that of Delphi's Object Inspector: When a component is selected on the page, the Property panel reflects the selection by displaying the different properties associated with that component. If no component is selected, the Property panel is blank. Also as in the Delphi IDE, you can change a property value by editing the contents of the edit box, selecting an option from a drop-down list, or bringing up an editor dialog. You can double-click on any property that has a list of choices (instead of clicking on the down arrow button and selecting the option) to advance to the next item in the list. The Project Tree PanelThe Project Tree panel on the right side of the designer is very informative. It also provides an easy way to navigate a report project's structure. The Project Tree contains three main nodes: Report Library, Global Page Catalog, and Data View Dictionary:
Toolbars and the Toolbar PaletteAs in Delphi, Rave includes two types of toolbars: component toolbars and IDE toolbars. However, unlike in Delphi (which uses the tabbed Component Palette exclusively for components), in Rave you can place either type of toolbar in the open area at the top of the designer or dock them in the tabbed Toolbar Palette. At first this process can be confusing, but after you arrange the toolbars to suit your needs (using the Dock and Undock shortcut menu commands, and not by dragging them as you'd expect) you'll probably find it quite flexible. The default component toolbars in Rave are Standard, Drawing, Report, and Bar Code. I'll describe the component toolbars in more detail later in this chapter. For the moment, suffice to say that other component toolbars may be present if you've installed add-on packages in the Rave Designer, and that components can be rearranged in the toolbars. Editor toolbars have the ability to change or modify the project or existing components. Here is summary of the commands they host:
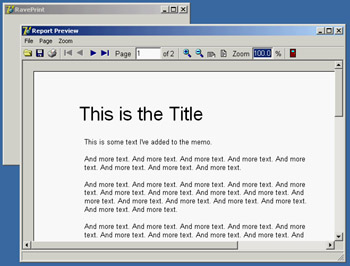
The Status BarAt the bottom of the Rave Designer is the status bar. The status bar provides information about the direct data view connection status and the mouse position and sizing. The data connection LED's color tells you the status of the Rave data system (DirectDataViews): gray and green indicate an inactive or active connection, respectively; yellow and red indicate specific data access situations (respectively, waiting for response or a time-out). The X and Y values are the coordinates of the mouse pointer in page units. When you're dropping a component on the page, if you don't release the mouse button, the size of the component will be shown by the dX and dY values (d stands for delta). Using the RvProject ComponentFigure 18.1 shows a trivial Rave report, which is stored in a .rav file. To connect this report to your Delphi 7 application you use the Rave page, which provides a series of components. The central component is RvProject. Place this component on a form or data module, set its ProjectFile property to a Rave file, and write this event handler code for a button: RvProject1.Execute; You now have a working application (the RavePrint example among the source code files) that can print a report and that includes an embedded print preview feature, as you can see in Figure 18.2. The referenced file should be distributed separately, and can be modified without having to change the Delphi program. As an alternative, you can also embed the .rav file into the Delphi executable by loading it in the DFM file. To accomplish this, use the StoreRAV property of the Rave project component. To control the most important settings of the report and the preview, you can hook an RvNDRWriter or an RvSystem component to the Engine property of the RvProject component:
Rendering FormatsThe Rave engine produces an NDR file or stream, generated by the RvNDRWriter. Rave's rendering engine can convert this internal representation to a wide variety of formats. To let a user choose one of the target file formats, drop the desired render components within a form of your Delphi program. When running the RvProject component's Execute method (as in the RavePrint example), you can choose one of the file formats in the dialog box displayed by Rave and visible in Figure 18.3. 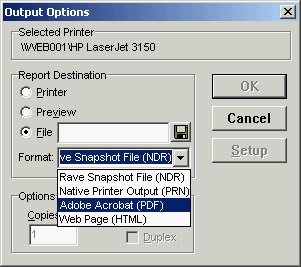
Figure 18.3: After executing a Rave project, a user can choose the output format or rendering engine. These are the available rendering components on the Rave page of Delphi's Component Palette:
In addition to letting a user choose a file format in the dialog, rendering can be done programmatically. For example, to convert a report to a PDF file directly, you can write the following code (taken again from the RavePrint example): procedure TFormRave.btnPdfClick(Sender: TObject); begin RvSystem1.DefaultDest := rdFile; RvSystem1.DoNativeOutput := False; RvSystem1.RenderObject := RvRenderPDF1; RvSystem1.OutputFileName := 'Simple2.pdf'; RvSystem1.SystemSetups := RvSystem1.SystemSetups - [ssAllowSetup]; RvProject1.Engine := RvSystem1; RvProject1.Execute; end; Data ConnectionsData connection components provide a link between data contained in a Delphi application and the DirectDataViews available in the Rave Designer. Notice that the value defined in the Name property for each data connection component is used to provide the link with the Rave report. For this reason, take care to avoid changing the component names after the DirectDataViews are created in Rave. The data connection components are as follows:
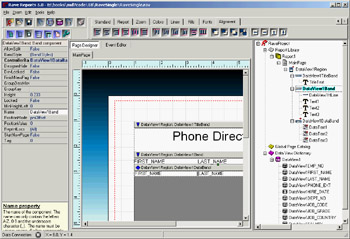
As a first example of how to construct a database-related report, I've created the RaveSingle example, which is an update of the DbxSingle program (built in Chapter 14, "Client/ Server with dbExpress") with a Rave project and a connection: object RvDataSetConnection1: TRvDataSetConnection RuntimeVisibility = rtDeveloper DataSet = SimpleDataSet1 end object RvProject1: TRvProject ProjectFile = 'RaveSingle.rav' end In the Rave Designer, I created a new project, the file RaveSingle.rav in the RaveSingle folder. To refer to the data exposed by the Delphi program, you need to add a data view by clicking the New Data Object button on the Project toolbar, selecting the Direct Data View option (more details on the other alternatives later), and choosing an available connection. The list you'll see depends on the connections available in the project currently active in the Delphi IDE. You can now create a report with the help of a wizard. From the Rave Designer menu, choose Tools ® Report Wizards ® Simple Table. Select the data view (you should have only one if you've followed these steps), and in the following window choose the dataset fields you want to include in your report. You should see a report like the one shown in Figure 18.4. As you can see the in the Project Tree, the wizard generated a report page with a Region containing three Band components: one for the title, one for the table header, and a data-aware band for the items. I'll cover the details of using these components in the section "Regions and Bands," later in this chapter; for the moment, I wanted to build and let you experiment with a working example. |
|
|||||||||||||||||||||||||||||||||||||||||||||||||||||||||||||||||||||||||||||||||||||||||||||||||||||||||||||||||||||||||||||||||||||||||||||||||||||||||||||||||||||||||||||||||||||||||||
|